 Saudi Arabia
 United Arab Emirates
 Qatar
 Kuwait
 Oman
 Bahrain
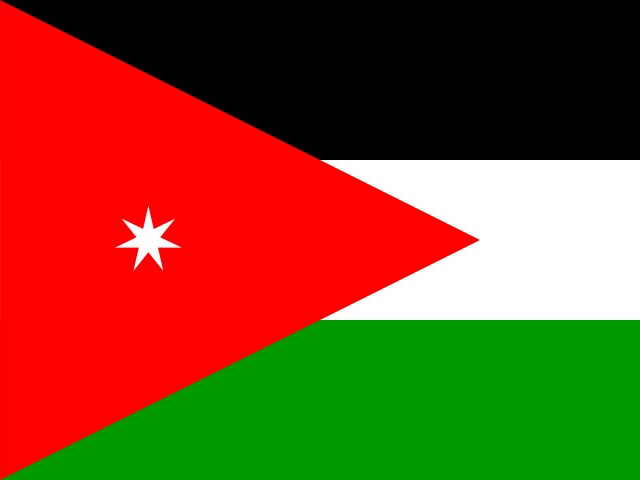 Jordan
 Iraq
 Lebanon
 Syria
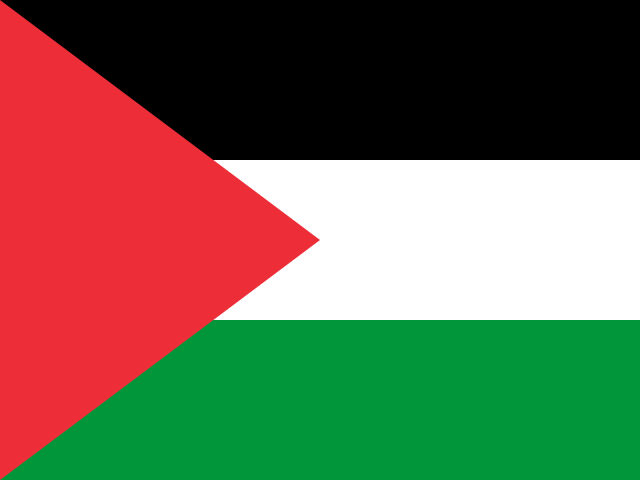 Palestine
 Egypt
 Sudan
 Yemen
 Morocco
 Algeria
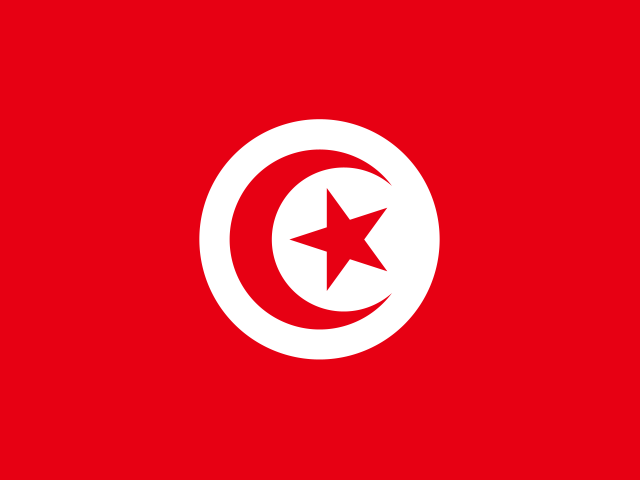 Tunisia
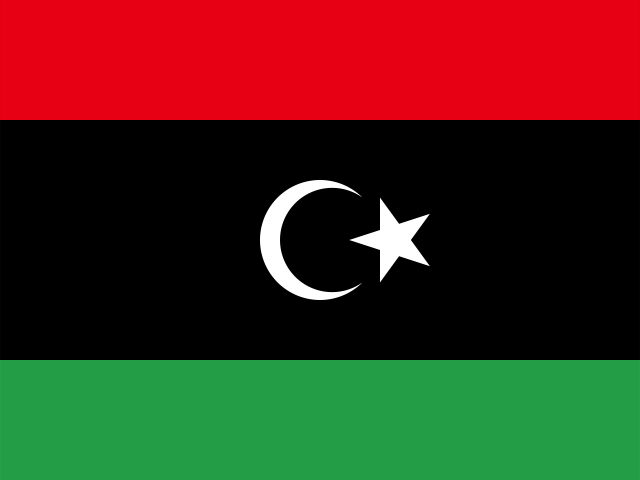 Libya
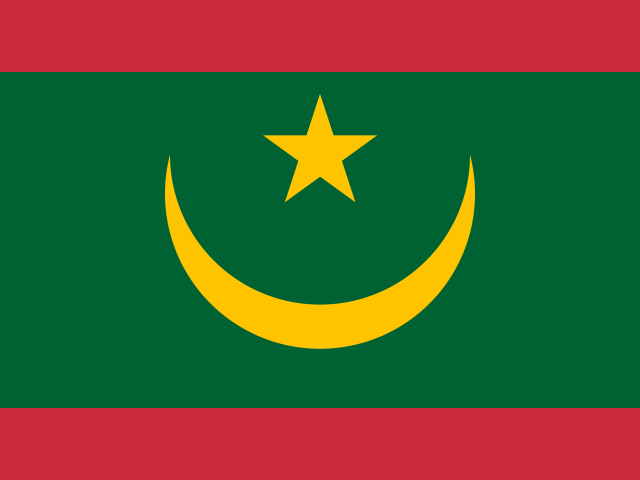 Mauritania
 Somalia
 Djibouti
 Comoros
Living in Arab countries in figures
Short answer
What is life like in each Arab country? The key World Bank indicators for 23 countries: income, buying power, prices, unemployment, inequality and health, explained in plain English, with the direction of each over 10 years.
| Country | Buying power per person ($) | Prices (US = 100) | Unemployment | Life expectancy | Direction |
|---|---|---|---|---|---|
| 🇸🇦 Saudi Arabia | 73,784 | 46.81 | 3% | 79 | Improving |
| 🇦🇪 United Arab Emirates | 79,344 | 63.36 | 2.2% | 83.1 | Mixed picture |
| 🇶🇦 Qatar | 128,883 | 56.27 | 0.1% | 82.5 | Mixed picture |
| 🇰🇼 Kuwait | 56,468 | 57.22 | 2.2% | 84.6 | Mixed picture |
| 🇴🇲 Oman | 42,295 | 47.16 | 3.3% | 80.2 | Mixed picture |
| 🇧🇭 Bahrain | 70,997 | 43.1 | 1.1% | 81.4 | Improving |
| 🇯🇴 Jordan | 12,632 | 42.34 | 16.5% | 78 | Mixed picture |
| 🇮🇶 Iraq | 14,267 | 37.92 | 15.5% | 72.4 | Mixed picture |
| 🇱🇧 Lebanon | 11,917 | 37.54 | 11% | 77.9 | Declining |
| 🇸🇾 Syria | 4,905 | 21.54 | 13.6% | 72.6 | Mixed picture |
| 🇵🇸 Palestine | 5,000 | 63.43 | 24.4% | 69.2 | Declining |
| 🇵🇸 Palestine (inside the Green Line) | 59,717 | 101 | 3.5% | 83.2 | Improving |
| 🇪🇬 Egypt | 20,204 | 15.27 | 6.8% | 71.8 | Improving |
| 🇸🇩 Sudan | 2,192 | 53.12 | 7.5% | 66.5 | Mixed picture |
| 🇾🇪 Yemen | 3,164 | 43.57 | 17.3% | 69.4 | Mixed picture |
| 🇲🇦 Morocco | 11,112 | 42.05 | 9% | 75.5 | Improving |
| 🇩🇿 Algeria | 18,586 | 32.56 | 11.6% | 76.5 | Mixed picture |
| 🇹🇳 Tunisia | 15,233 | 30.57 | 15.1% | 76.7 | Mixed picture |
| 🇱🇾 Libya | 16,521 | 39.03 | 18.8% | 71.1 | Mixed picture |
| 🇲🇷 Mauritania | 7,676 | 28.63 | 10.3% | 68.7 | Improving |
| 🇸🇴 Somalia | 1,643 | 40.25 | 18.9% | 59 | Mixed picture |
| 🇩🇯 Djibouti | 8,452 | 46.21 | 26% | 66.2 | Improving |
| 🇰🇲 Comoros | 4,238 | 48.5 | 3.8% | 67 | Improving |
Buying power is GDP per person at purchasing power parity. Direction combines real income per person, unemployment and life expectancy over about 10 years. Tap a column heading to sort.
Sources
- GDP per capita, PPP (current international $)
- Price level index (GDP), United States = 100
- Unemployment, total (% of total labor force) (modeled ILO estimate)
- Life expectancy at birth, total (years)
- GDP per capita (constant 2015 US$)
Source: World Bank, World Development Indicators, data last updated 13 July 2026.
Send it to someone who needs it
Share this page in a second, or add the site to your phone so it opens with one tap, like an app.
On iPhone: tap Share in the browser, then "Add to Home Screen".
Bookmark it: Ctrl + D
Follow us on InstagramFacebook